- July 8, 2025
You may have heard about the failure of Silicon Valley Bank (SVB) and have some questions about it. I’ll share the short story on the bank without getting too far into the nuances of bank regulation and balance sheets, or making any guesses on what happens next. There will likely be more information that will come out in the weeks and months to follow, but there are some basic facts and observations that are worth mentioning.
What happened?
The story of SVB seems to be two-fold. One, that of a bank taking on too much risk in search of return in the pre-2022 interest rate environment. And two, having a very homogeneous deposit base as a result of its market niche. Neither one of these situations alone is sufficient to have led to what happened, but when combined they formed the proverbial perfect storm.
The basics of banking go like this: When we make deposits, the bank invests those deposited dollars in either loans to businesses and consumers, or securities. Our deposits are liabilities to the bank and it pays us interest for the use of our funds. The loans and securities are assets to the bank and it earns interest on those investments. The difference between what it pays us for our deposits and what it earns on its loans and securities is called the net interest margin, which is effectively the bank’s earnings. The more interest it can earn on its assets and the less it can pay us on our deposits, the greater its earnings. It will make more loans and buy more securities than it has in deposits – this is leverage. The difference between the assets and liabilities is the bank’s capital. One more important thing: the bank will at any time only have a fraction of its deposits in cash available for withdrawals.
Fortunately, the risk in the assets on SVB’s balance sheet is nothing like what banks experienced 15 years ago during the Financial Crisis. Banks mostly hold Treasurys, specifically Treasurys that are long-term and have been more susceptible to price reductions as interest rates have risen in in the last year. Bond prices and interest rates move in opposite directions and the longer the term of the bond the more pronounced that relationship is. Typically banks would hold shorter term securities which more closely match deposits and pose less risk. SVB seems to have deviated from this tradition in an effort to increase the interest it earned on its securities when interest rates were low.
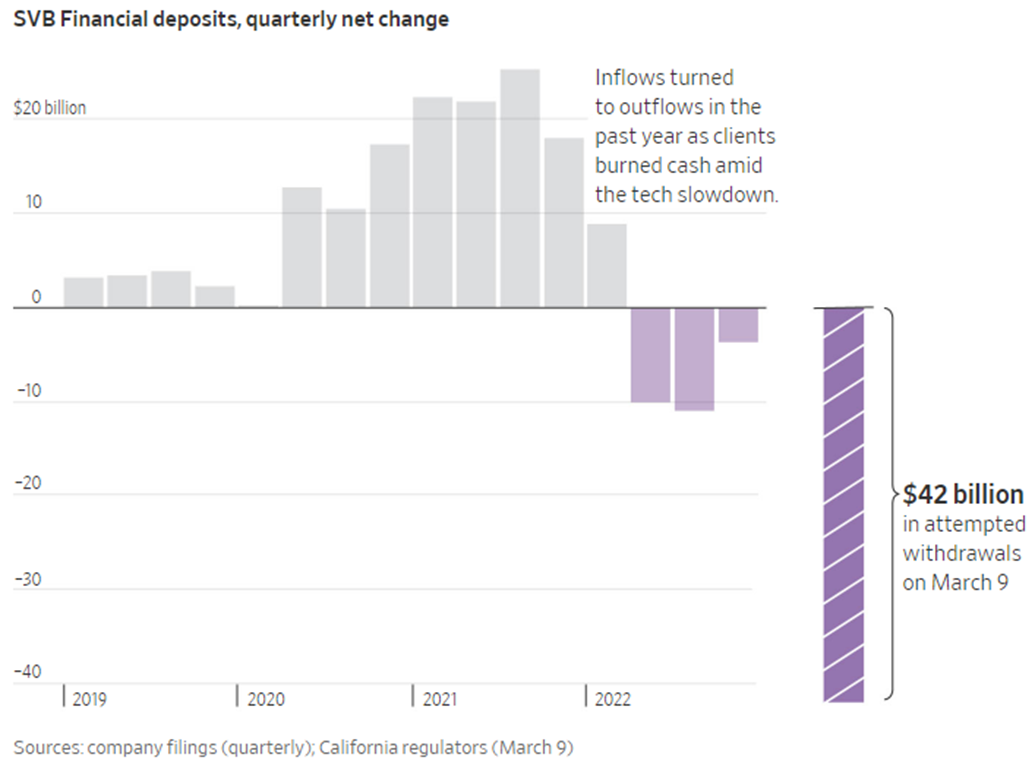
Now on to the problem with its depositors. SVB’s depositors were more than 80% concentrated in the Venture Capital/Tech/Biotech/Start-up sectors and many were companies in addition to individuals. A high concentration of corporate depositors resulted in more than 90% of their total deposits exceeding FDIC insurance limits. With the slowdown in technology-related IPOs and funding rounds in the last year, SVB’s depositors had been withdrawing more than they were depositing in recent months, thus depleting SVB’s available cash.
As deposits and cash were leaking out, their portfolio of Treasurys was declining in price because of the Fed’s rate raising in effort to rein in inflation. This combination reduced their capital. In an effort to avoid selling their securities at discounted prices, that would have forced SVB to book the losses and effectively wipe out all of their capital, they decided to try to raise capital either through their venture network or issuing stock.
This was when the world learned of SVB’s depleted capital situation and also when SVB learned that their deposit base was actually more concentrated than it appeared. Despite tens of thousands of depositors, thousands were affiliated with, or advised by, a few dozen Venture Capital firms. Many of these firms blanketly advised their affiliated businesses to withdraw their funds. Here we go back to the fact that many of these depositors are companies with their payroll funds deposited at SVB and carried large uninsured deposits. This culminated with a total of $42 Billion of withdrawal requests, or about 25% of its total deposits, on Friday March 10th, which more than wiped out their capital and reserves, rendering the bank insolvent and forcing regulators to take over SVB.

Are there, or will there be, others?
This seems to be a situation unique to SVB and a handful of other institutions with similarly concentrated depositors or poorly managed asset portfolios. The big, diversified banks – and even smaller banks with more diversified depositors – seem to not be in this situation. As with so many things in investing and finance, diversification is a key variable. As far as spillover effects into the rest of the banking sector, bank balances sheets as a whole are much better managed now than many times in the past, but there will be some that over-extend.
The generally high quality of assets on banks’, and even SVB’s, balance sheet is what made it relatively easy for the Fed and Treasury to step in to effectively backstop all of the deposits. They created a lending program to lend against or redeem Treasurys at par value rather than forcing SVB or other troubled banks to sell at discounted prices. This would have been less palatable had banks’ balance sheets been riddled with the toxic assets of 2008.
Most available evidence points to this being akin to a run on a particular bank as opposed to a systemic risk. As SVB’s capital troubles became known, its depositors were acting rational in wanting to get their cash out in order to sustain their businesses. I’ve read that this can be compared to the notion that the first one out of a burning building survives and everyone wants to be first out. I’ve also read that the building wasn’t really burning but in the rush for the exit the one candle in the foyer was tipped over. The reality is probably somewhere in the middle.
What does this mean for the Fed’s interest rate increases?
If the Fed’s interest rate increases played a role in setting up this situation, it makes sense to wonder where they go next on their path. This can by a slippery slope to guessing what happens next, and I promised I wouldn’t do that. There are, however, some interesting facts and market responses to this question from the last week.
As recently as last Wednesday, Jerome Powell, in his testimony to congress, remained laser-focused on his fight against inflation. He even indicated that the Fed’s benchmark interest rate may have to go higher in upcoming meetings than the market had been expecting and that it may need to remain “higher for longer.”
On March 1st, the market was placing the odds of a .25% Fed funds increase during its meeting next week at 75% and the odds of a .50% increase at 25% with the expectation of a peak rate of 5.5%. Following Powell’s testimony, the expectation shifted to a 75% chance of a .50% increase with small chances for only a .25% increase and even a small chance of a .75% increase with the peak rate expectation going to 5.75%.
By Tuesday March 14th, after the SVB event and another lower inflation print, the chance of a .50% increase has effectively fallen to zero, with a heavy emphasis on a .25% increase and a small chance of no increase at all. And the expectation now is that the rate will peak at 5.25%
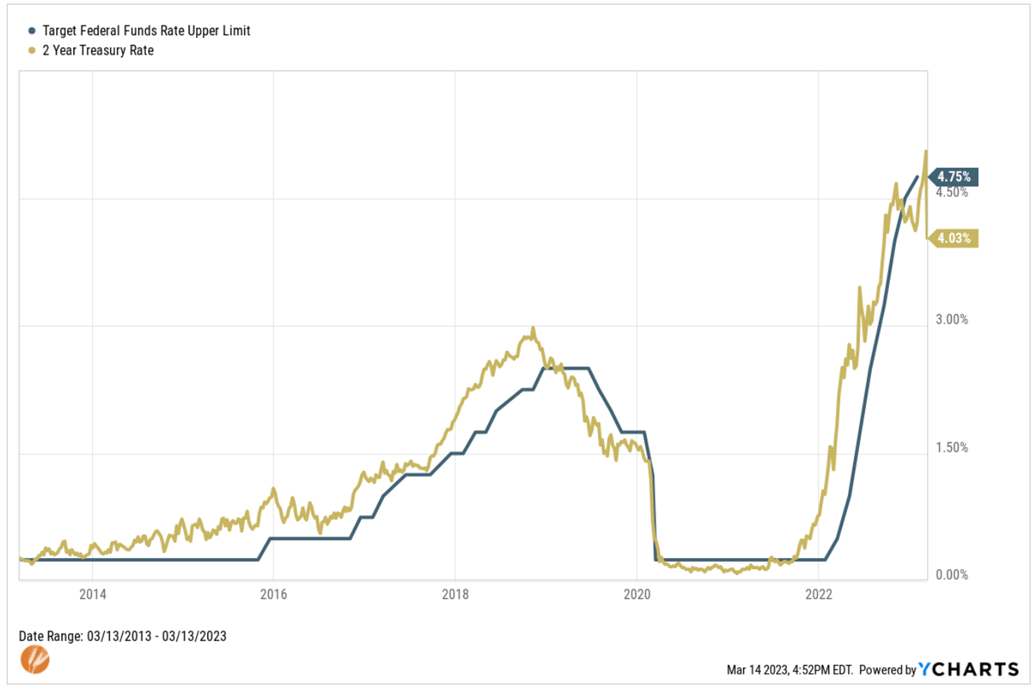
The 2-year Treasury rate has the closest market-based rate to the Fed funds rate, nearly perfectly tracing the Fed’s moves:

The 2-year note peaked last week at just over 5% following Powell’s testimony and touched a low point of 3.8% on Monday March 13th before recovering to about 4.4% on Tuesday March 14th. The market as a whole seems to be pricing in a near completion of the Fed’s rate increase.
What does this mean for me?
One of the lessons in this situation is to not over-extend on this risk side of the equation in search for return. It may be frustrating when the market – stocks or bonds – aren’t offering the expected returns for a given level of risk in the short-term. Those expected returns will come with time, but taking on too much risk in the short-term can have long-term consequences. For diversified investors with portfolios that match their financial plan, this is likely to fall into the category of “there’s always something” that doesn’t warrant altering a portfolio.
It does, however, reinforce the best practice to structure checking and savings accounts to fall within the FDIC’s insurance limits, which can be summarized as $250k per individual and $500k per joint account. Even though all depositors are ultimately going to be made whole in this situation, I can only imagine the stress that was endured over the few days waiting to learn about the status of their deposits.
There are certainly many more details on this situation than covered here, but I hope this was helpful in understanding the events of the last week. Please let us know if you have any questions.
Thanks for reading.

Matt Weier, CFA, CFP®
Partner
Director of Investments
Chartered Financial Analyst
Certified Financial Planner®


