- July 8, 2025
Investment markets’ ability to seemingly defy expectations continued in 2021. There were probably 7,296 reasons why stocks shouldn’t have gone up in a straight line. I’m exaggerating slightly, but here’s an abridged version of the list of reasons why stock returns shouldn’t have been as strong as they were in 2021 (in no particular order):
- They went up too much in 2020 relative to risks in the economy
- Supply chain disruptions were crippling the economy
- We’re still in a covid-influenced economy
- Domestic political uncertainty
- Geopolitical uncertainty
- Stocks are too expensive (high Price-to-earnings ratio)
- Inflation is expected to rise
- Expectations for higher interest rates
- Too much Government stimulus
- Government stimulus expired
- The Fed is keeping interest rates too low for too long
- New covid variants
- Natural disasters
- Congressional squabbles over the debt ceiling
- Inflation is higher than it’s been for quite some time
- The S&P 500’s returns are too dependent on big tech companies
- Tax rates might rise
- Civil unrest
- Too many workers remain out of the workforce
- Wages are rising too fast
- The S&P 500 hit 70 (!) record high closing levels during 2021 (some believe a record high foretells imminent decline)
- Government debt is too high
- Individual investors chasing “meme stocks” were distorting financial markets
- The Fed’s balance sheet is too big
- China’s economy is growing more slowly than in the past
- Crypto currencies are going to displace traditional finance
- Gold didn’t rise as inflation went up (I imagine this broke a lot of old Wall Street models)
- This bull market has been going on too long
- A pundit who predicted a previous “crash” says stock prices are again in “bubble territory” and due for a major decline
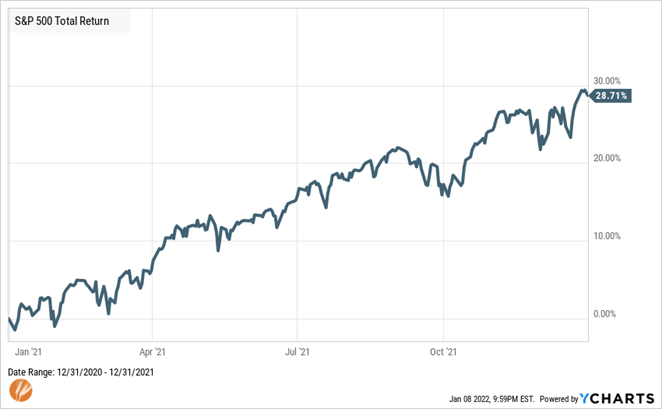
Despite all of this, the S&P 500 produced a total return of 28.7%. The abridged list contains one reason why stocks shouldn’t have gone up for every percentage point they did go up in 2021. I took the liberty of rounding the .7% up to get to 29. Of course, there are more stocks than the S&P 500, but more on that later.
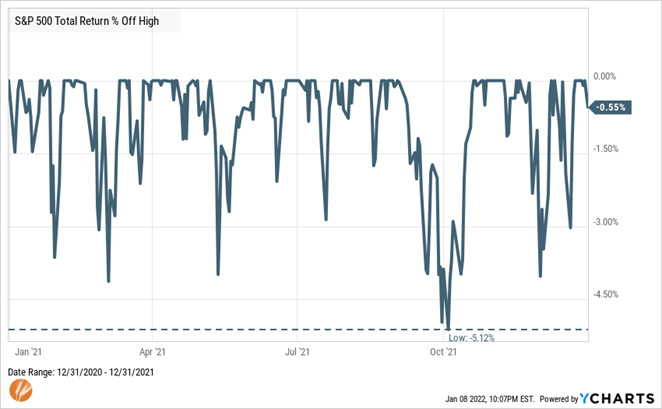
And the evidence of noting stocks went up in a straight line – the largest draw down during the year was barely 5%. This compares to an average intra-year draw down of nearly 15% over the past 40 years. So, by most measures it was a fairly benign year on the volatility front. It’s worth noting that when we’re accustomed to declines not exceeding 5%, the next 10% or 15% decline will feel much worse and more uncommon than it actually is.
I could compile a list of 29 reasons why stocks did go up as much as they did, but the point is that risks and reasons not to invest are always present. These risks are what cause the volatility we experience in markets. Sometimes, like in 2021, volatility is relatively quiet and other times it can actually be quite unsettling.
Something to keep in mind the next time stocks have a periodic 10% or 20% draw down is that without these risks and accompanying volatility, they wouldn’t produce the returns that they have in the past and are expected to in the future. Absent these risks and volatility, we couldn’t expect stock returns of much more than Treasury bonds. This is a more than fair trade-off. Here’s a look at this trade-off over the last 27 years:
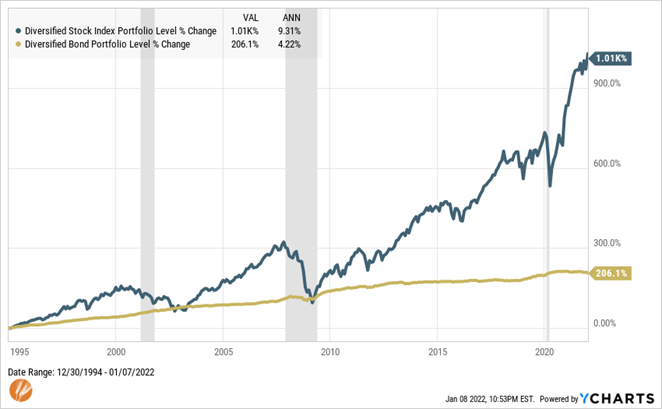
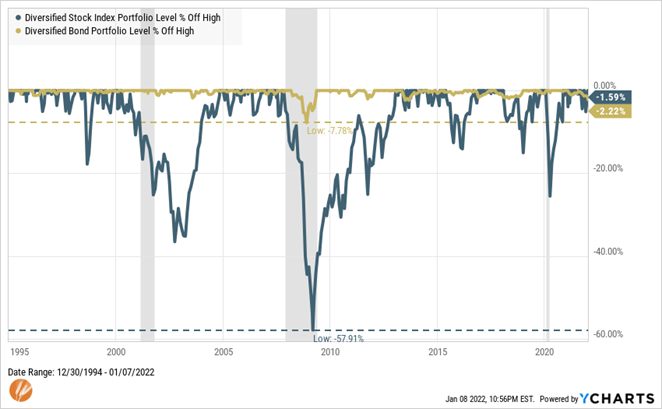
The 27-year time period is admittedly cherry-picked, but for good reason. It includes three recessions (periods in gray), six 20%+ stock draw-downs* (three of which were greater than 35%), multiple-year periods when US stocks led the way, multiple-year periods when international stocks led the way, and a ten year stretch when US stocks produced negative total returns.
Every one of these 27 years could have generated a long list of reasons stocks shouldn’t have gone up. Indeed, in some years, the lists overwhelmed markets and they did in fact experience negative returns. But again, the chance of periodic declines in stock prices is a feature rather than a bug in their design.
The much shorter, but more meaningful, list is why stocks do go up over time amidst the long list of reasons why they should or could decline:
- Companies are in the business of growing their earnings regardless of the environment they are operating in, and they have strong track record of success in this department (see table below)
- Investors generally believe that item 1 will continue
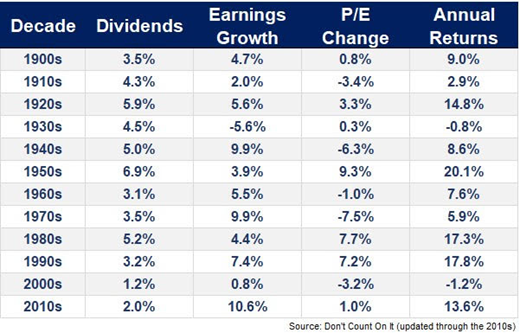
The table above ends with 2019 numbers, but even after 2020’s decline in earnings, S&P 500 earnings are 25% above 2019’s level through the third quarter of 2021 (most companies have not? reported fourth quarter earnings at this time).
The component of returns that has varied the most from decade to decade is the price-to-earnings ratio, or how much the market is willing to pay for the earnings companies produce. By and large, companies have an impeccable track record of increasing their earnings over time, but it’s investors that are often overly influenced either by the prevailing risks or the occasional euphoria.
Since it is prediction season on Wall Street, it is a reasonable conjecture that corporate earnings will continue to increase; however, how the market responds to that, especially in the short term, is anyone’s guess.
This consistency of earnings growth is one of the reasons why as long-term, goal-focused investors we can use the feature of volatility or changing short-term sentiment to our advantage rather than treat it as a bug or flaw. We can let our earnings and dividends compound over time while avoiding attempts to change strategies based on the annual list of reasons why stocks should or could decline.
Key to our ability to succeed in this is having a portion, commensurate with our goals, of our portfolio invested in a way that isn’t as impacted by short-term volatility and significant declines as stocks. This is typically accomplished with bonds and brings me to the first of a few current hotly debated concerns worth addressing.
What happens if interest rates go up?
As long-term investors, we should hope they do! It can be a validating sign of a stronger economy and sets the stage for higher future returns from bonds. However, when interest rates do go up, bond prices will fall. This is true. Nevertheless, as interest payments rise, they will partially and at some point, completely, offset price declines. These higher interest payments actually bode well for future returns.
The Bloomberg US Aggregate bond index (a broad measure of US Bonds similar to the S&P 500 for stocks) had its third worst calendar year return ever in 2021…at -1.54%. This was in a year that saw the 10-year Treasury note yield increase from 0.93% to 1.54%, or a 63% change.
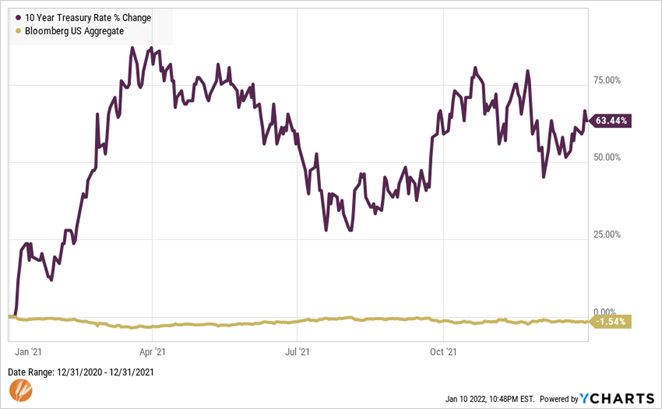
So, while bond returns can and will be negative from time to time, a bad year for bonds is a bad afternoon for stocks. And for this reason, even if interest rates do rise, they stand to serve as an effective complement to stocks.
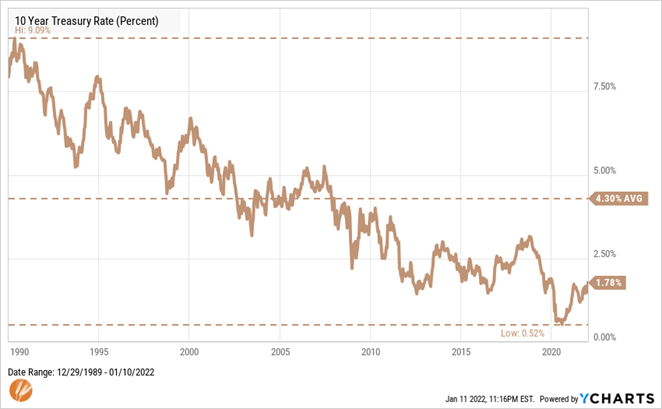
Like what was mentioned with stocks previously, in regard to periodic 10% - 15% declines being normal occurrences, simply getting back to a “normal” level of interest rates is going to feel much more out of place than it actually is. Take a look at the chart below to put today’s interest rates (10-year Treasury) in perspective with recent history:
It seems like Stock Market Returns are Dominated by Big Tech and Speculative Stocks
True, the five biggest stocks (Apple, Microsoft, Amazon, Tesla and Google as of this writing) comprise over 20% of the S&P 500 and get all the headlines – in most cases rightfully so as their business and stock performances have been outstanding.
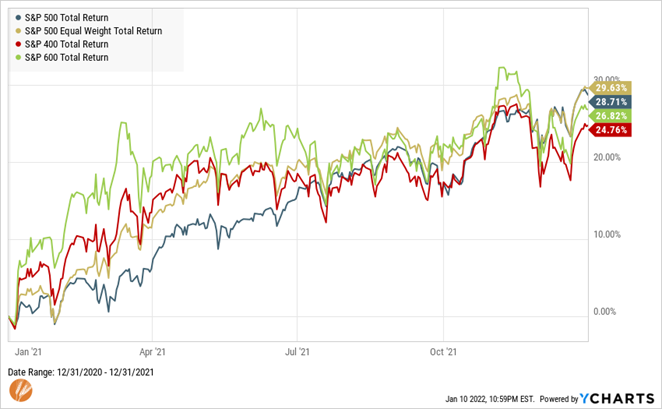
But if they were driving a disproportionate amount of total stock returns – for the S&P 500 or the total market that includes mid and small sized companies – we would see much more dispersion among the indexes in the graph below. The S&P 500 is dominated by large companies, but the performance of small and mid-sized company indexes were quite similar in 2021. Further, as the S&P 500 is size-weighted, the largest companies presumably should have an outsized impact on overall performance. However, the equal-weighted version of the index, which treats all stocks the same regardless of size, slightly outperformed the size-weighted index.
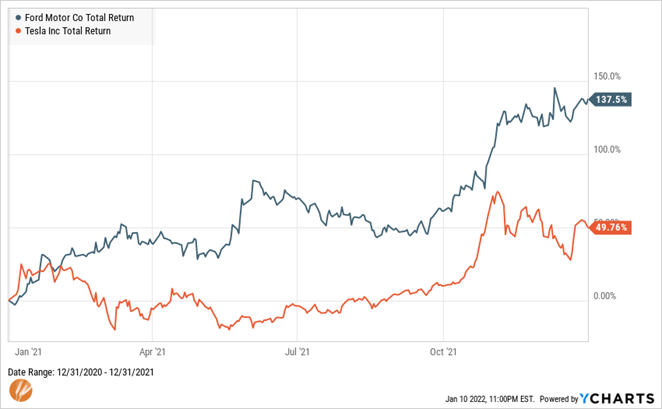
A good example of things quietly happening behind the headline-grabbing stocks is illustrated below. Despite its impressive performance, Tesla was outperformed by Ford by nearly a 3 to 1 margin in 2021. It can be assumed that much of the performance of Ford can be attributed to its early success in its push toward electric vehicles, which along with Telsa’s products, garner much of the markets’ attention. Despite expectations of the internal combustion engine driven vehicle soon going the way of the buggy whip, the Energy sector notched the best 2021 performance of all S&P 500 sectors.
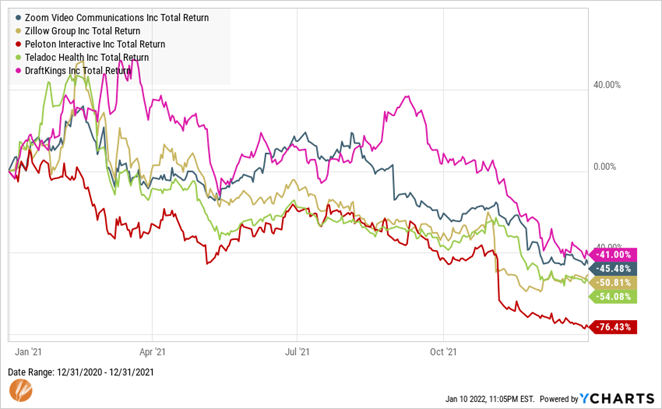
And some of 2020’s most spectacular and speculative performers saw their fortunes turn rapidly in 2021. Despite this, broad-based indexes rose across the spectrum of investments. As is often the case, there is a lot of room for investment success behind the headlines and following yesterday’s best performers is rarely the best investment for tomorrow.
Inflation is rising; should our investments change?
By now, it’s no surprise that inflation rose higher and has lasted longer than the Federal Reserve’s estimates. As this was written, it was just announced that overall inflation was 7% in 2021 and the Fed’s preferred gauge was up 5.5%. While substantial evidence remains that much of this stems from pandemic-related supply and demand disruption, it still often leads to thoughts that maybe a change to an investment strategy is warranted.
I’ll offer two charts as evidence that maintaining one’s long-term, goal-focused investment strategy is likely the best course of action, or in this case, inaction.
It has been conventional wisdom that gold is an effective investment hedge and bond investments are to be avoided in times of high or rising inflation. In a year with the highest inflation in a couple decades, Gold underperformed the asset class assumed to be most negatively impacted by inflation. See above charts for stock returns in the same year.
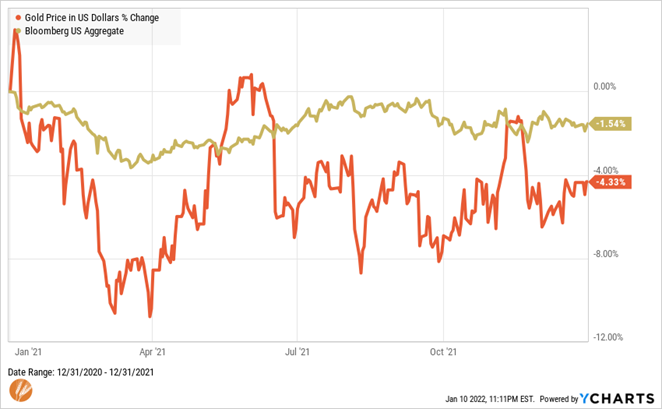
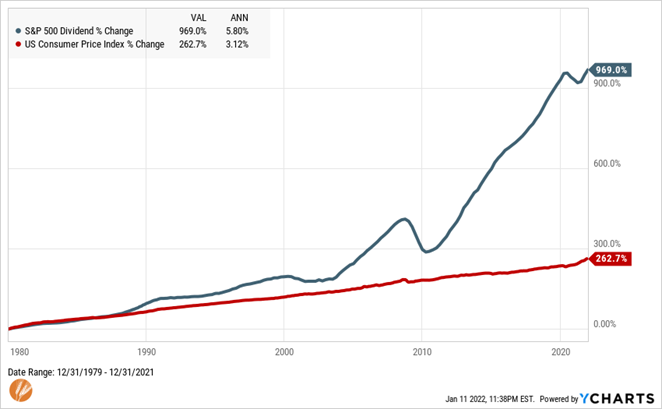
Two pitfalls enter the picture when attempting to alter an investment strategy based on external forces. The first one is that it is effectively market timing, and we know this tends to work poorly in most cases. The other is specific to gold itself – unlike the table above that shows companies’ ability to raise their earnings generally faster than inflation over time, gold has no such ability. Which brings me to the second chart showing the growth of dividends relative to inflation. Dividends are a direct payout to shareholders from companies’ earnings growth and have an unparalleled track record of consistent above-inflation growth.
As a new year starts there will surely be a new list of reasons why stocks could or should decline – and they may even temporarily succumb to those pressures. There is likely to also be a chorus feeding continued speculation in parts of the markets. Regardless of which side is louder, the most successful investment strategy is always to remain a long-term, goal-focused approach.
For many, 2021 was not much easier than 2020. We’re filled with gratitude for the confidence and trust that you continue to place in us and it’s our pleasure to serve you.
Best wishes for a happy and healthy 2022.
*1998 and 2018 saw 20% declines in the S&P 500 index, but this chart depicts a more diversified portfolio of stocks and includes dividends both of which muted the illustrated decline.

Matt Weier, CFA, CFP®
Partner
Director of Investments
Chartered Financial Analyst
Certified Financial Planner®


